While the pre-made status graphs can provide you with information
of the current state of your MySQL server, there may be
additionally information that you wish to visually track. The
MySQL Administrator Health section allows you to
add additional tabs and graphs to track any information that is
contained within the
Status
Variables.
The first step in creating custom health graphs is to create a new
page in the Health section to store your
graphs. To create a new page right click anywhere in the working
area and choose the option. You will
be prompted for a page name and description and a new page will be
created.
Once you have created a new page, you will need to create a group.
All graphs are organized into groups. For example, the
Key buffer usage and Key buffer hit
rate graphs are both members of the group titled
Key Efficiency. To create a group, right click
within your newly created page and choose the option.
To create a custom graph, right click within a group and choose the option. The following dialog will appear:
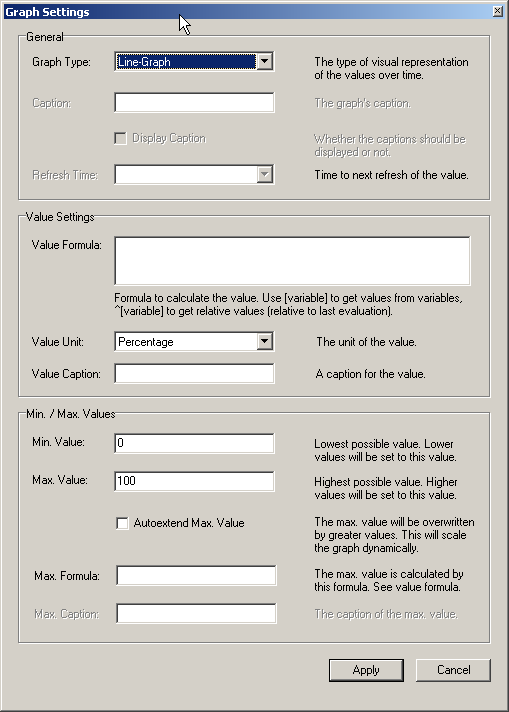
The Line-Graph is appropriate for showing trends over time, while the Bar-Graph option will be more appropriate for showing percentage information. If you choose to create a bar-graph, you will need to choose a caption for your graph. Captions are not allowed for line-graphs.
The data on your graph is set using the Value
Formula. You can create a formula using any of the
variables available in the
Status
Variables and
System
Variables tabs. To use the value of a variable, wrap the
variable name in square brackets (for example,
[com_select]), if you want the relative value
of the variable prepend the square brackets with a
^ character.
For example, if we wanted to graph the percentage of temporary tables that were created on disk we could use the following formula:
[created_tmp_disk_tables] / [created_tmp_tables]
If we wanted to track the number of temporary tables created on a continuous basis, we could use the following as our formula:
^[created_tmp_tables]
After creating your formula, select the Value
Unit that best represents your data. You can choose
from Percentage, Count,
Byte, and Seconds. In our
examples we would use Percentage for the first
example, and Count for the second. You can also
assign a caption to the value.
Once your formula is assigned you should configure the
Max. Value and Min. Value
for the graph, so that your data is spread evenly across your
graph. You can set arbitrary values based on your estimates of how
large the values will grow, and check the option to allow MySQL Administrator to automatically
increase the Max Value setting automatically to
prevent your data from extending off of your graph.
You can also set the Max. Value option by way
of a formula assigned in the Max Formula
field. The same syntax applies in this field as applies in the
Value Formula field. For example, if you were
creating a bar graph tracking the number of temporary disk tables
created, you could use
[created_tmp_disk_tables] as the
Value Formula and
[created_tmp_tables] as the Max.
Formula.