Table of Contents [+/-]
Note
MySQL Enterprise subscription, MySQL Enterprise Monitor, MySQL Replication Monitor, and MySQL Query Analyzer are only available to commercial customers. To learn more, see: http://www.mysql.com/products/enterprise/features.html.
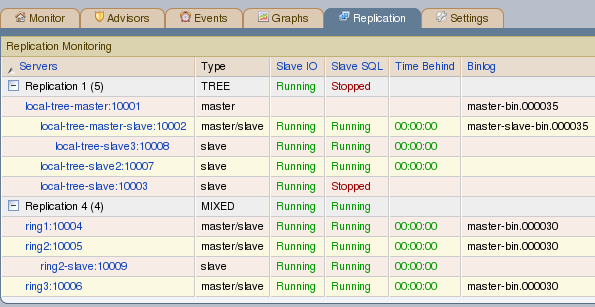
Navigate to the Replication page by choosing the
Replication tab. This page provides a quick
summary view of the state of your replication servers or, if you
wish, you can drill down and determine specifics about any master or
slave.
Note
Servers, whether masters or slaves, must be monitored in order for them to appear on this page.
Note
There will be no Replication page if your
subscription level does not support this feature.
The Replication page groups all master servers
with their slaves. Masters and their slaves are autodiscovered and a
grouping is created. This grouping shows up on the replication page
and also in the Heat Chart on the
Monitor page. Scans run on a five minute
interval, so depending upon the order of discovery, it can take as
long as 2 polling intervals to create a complete group.
Discovery events are logged to the Replication
log. To view this log navigate to the Settings
page and choose the Logs link. View all
replication-related events by clicking the
Replication link. This log can be a useful tool
should you need to debug the replication topology discovery process.
Warning
The agent must be installed on the same machine as the server you are monitoring in order for discovery to work properly. Do not use remote monitoring.
Replication groups can be managed from the Manage
Servers page in the same way as other groups. However, any
slaves removed from a server group will automatically be restored to
that group. It is also possible to add nonslaves to a replication
grouping. For more information about server groupings see
Section 4.3.2, “Grouping Servers”.